There are two ways to extract the edge coordinates of an region of interest (ROI):
1) The long way
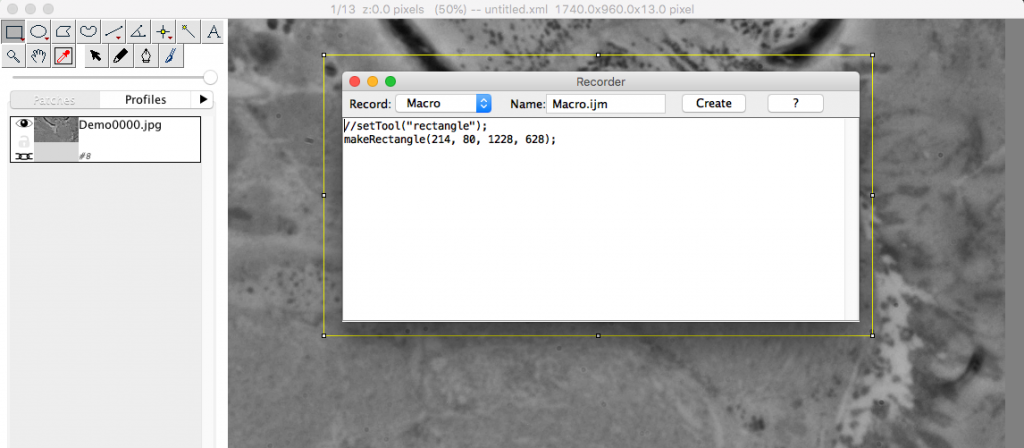
Before starting to draw the region of interest (rectangle tool) and exporting the images (export –> make flat image), we start the macro recorder (FIJI Side bar: Plugins –> Macro –> Record), which allows to read out the coordinates of the of the ROI used for the export.
2) The fast way
Draw the ROI and pretend you want to align the images (right click: align –> align layers) . The following pop-up window will show. Readout the coordinates and cancel the process. Export the images as usually, done!
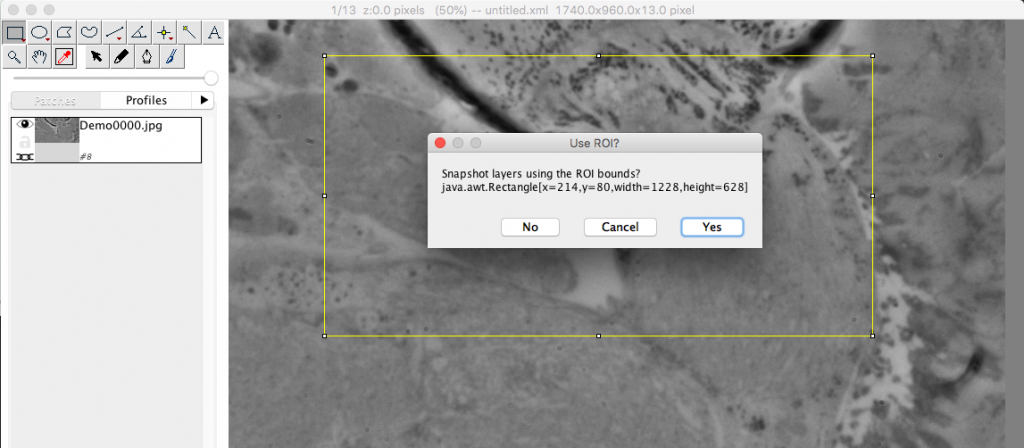
In both cases only the first two values (x & y) are needed for a later re-import e.g. of labels of labeled structures within the sub-stack into the complete stack.